


Creating Custom Dimensions and Tracking Word Count & Range in Google Analytics
The more data you can collect about your website, the better suited you’ll be to improve your content and grow your audience. Personally, I was curious what impact the length of my blog posts was having on the number of page views they received, so I set about tracking the word count of my posts in Google Analytics.
For the purposes of this post, I’ll be demonstrating how to track these two values specifically, but the same concept applies to any custom Google Analytics dimensions you’d like to track, so feel free to follow along and substitute your own dimensions. I’ll also be trying to keep the (very minimal) JavaScript required to perform the tracking as simple and copy-and-paste-able as possible, for the non-technical folks out there.
For my experiment, I wanted to track two Custom Dimensions to track the raw number of words in a post, as well as predefined ranges for easy graphing. For instance, I might track a Word Count of 253 and a Range of 0-499.
Creating Custom Dimensions
The first step is to create the custom dimensions in Google Analytics. Here’s how you do that:
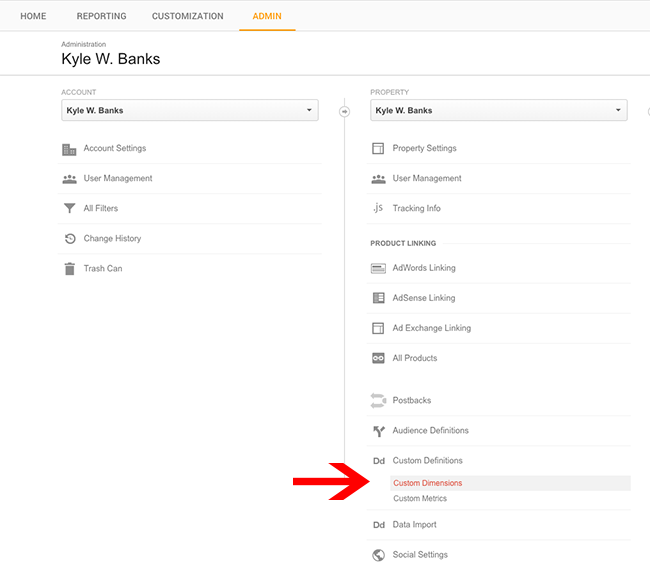
- Go to the Admin panel of your Google Analytics property.
- Select Custom Definitions → Custom Dimensions:
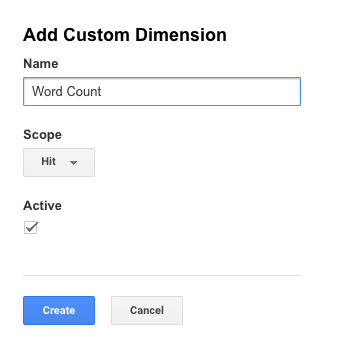
- Click New Custom Dimension
At this point we’ll create two new dimensions: Word Count and Word Count (Range). Simply fill out the form as seen below, once for Word Count and once for Word Count (Range):
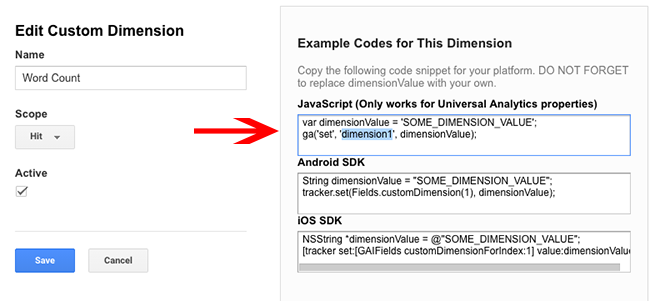
Now that we have the two custom dimensions setup, we’ll need to get the dimension identifier for each. The identifiers are in a sequence of dimension1, dimension2 and so on. If these are your first two custom dimensions in Google Analytics, they’ll likely be dimension1 and dimension2, but make sure to double-check. In the image below, the dimension identifier is dimension1:
Tracking the Word Count
At this point you should have your two custom dimensions created, and their identifiers. I’ll be using dimension1 for Word Count and dimension2 for Word Count (Range), so make sure to substitute your own identifiers if they don’t match mine.
Somewhere on your website you likely have a line of JavaScript that looks like so:
ga('send', 'pageview');
This tells Google Analytics to track a page view, but we want to add our custom dimensions to it. We’ll modify the tracking code to specify the dimensions like so:
ga('send', 'pageview', {
    'dimension1': getWordCount(document.body),
    'dimension2': getWordCountRange(document.body)
});
Again, make sure the dimension identifiers match your own!
What we’re doing is setting the dimension values to the result of two new JavaScript functions we’ll be adding: getWordCount and getWordCountRange. Here’s what those functions look like:
function getWordCount(e) {
    function getText(el) {
        var ret = "";
        var length = el.childNodes.length;
        for (var i = 0; i < length; i++) {
            var node = el.childNodes[i];
            if(node.nodeType != 8) {
                ret += node.nodeType != 1 ? node.nodeValue : getText(node);
            }
        }
        return ret;
    }

    return getText(e).split(/\s+/).length;
}

function getWordCountRange(e) {
    var groupingSize = 500;

    var wordCount = getWordCount(e);
    var lower = (wordCount - (wordCount % groupingSize));

    return lower + " - " + (lower + (groupingSize - 1));
}
You can add these two functions directly above your tracking code (the ga(‘send’, … snippet) for the easiest implementation.
If you are familiar with JavaScript, these functions should be pretty straightforward to you, but if not don’t worry about it. One thing to note however is the groupingSize in getWordCountRange. For my purposes, I wanted ranges like 0 - 499 and 500 - 999 so I use 500 for the groupingSize. You can modify this value to get whatever size ranges you’d like.
Graphing the Results
After updating your site with the required JavaScript, you’ll likely need to wait a few minutes to a few hours before Google Analytics starts processing the dimensions. Regardless, you can go ahead and create a new graph in your Google Analytics Dashboard.
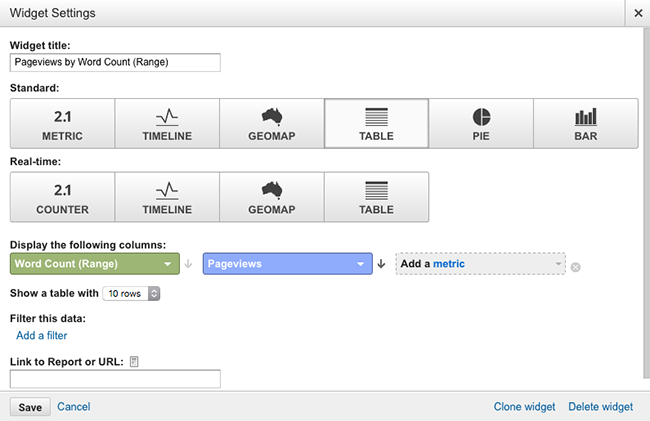
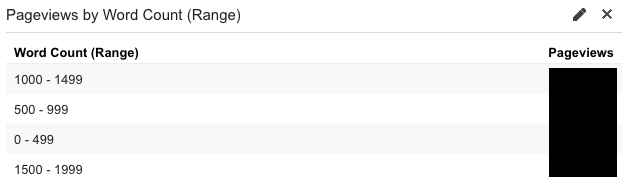
Simply select your graph type, use the new Word Count or Word Count (Range) dimension as the graph dimension, and the metric you want to group by. For myself, I’ll be using Word Count (Range) for a nicely grouped table, and the number of Pageviews to see what ranges are the best performing:
Once that’s setup, give Google Analytics a little bit of time to start processing your new dimensions (usually a couple minutes to an hour or so), and you should see something like so:
I also particularly like the pie chart version of this data, as I don’t really care about the exact number of page views, more a general idea of which are the best performing:
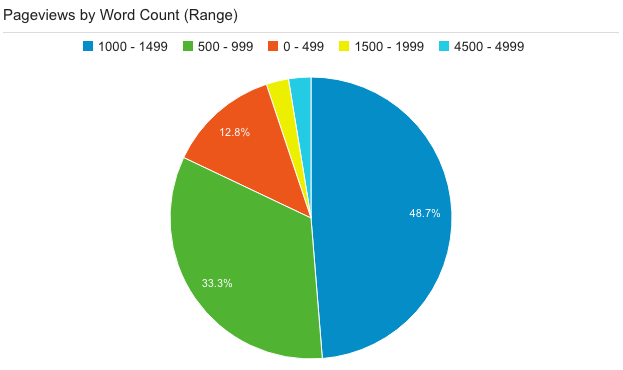
These screenshots are currently only showing about half an hour worth of data, but now that they’re setup I’ll eventually be able to use this to determine what length blog posts are the best (and worst) performing. The more you know!